An initiative created by:
![]()
![]()
Made possible with support from:
![]()
![]()
Introduction
Data visuals are integral to the communication of Intergovernmental Panel on Climate Change reports, and to the communication of climate change research more generally. Data visuals often contain important information relevant to diverse stakeholders in society, but they can be difficult for non-experts to understand.


Below, we present twelve evidence-based guidelines, encapsulated by the ‘MADE’ principle, to help climate researchers enhance the accessibility of their data visuals, while maintaining scientific rigour. A full report is also available, providing further details and visual examples, together with recommendations for the IPCC.
The MADE principle
Effective data visuals of scientific evidence are ones that are ‘MADE’. That is, they consider the:
Message: Does the visual communicate a clear message?
Audience: Is the visual appropriate for the intended audience(s)?
Design: Does the visual use evidence-based design principles?
Evaluation: Has the visual been tested with the audience(s)?
Guidelines
The 12 guidelines below provide building blocks for putting the MADE principle into practice. Click on each guideline for a brief summary of the rationale behind it and practical steps to apply it to your visuals. Additional detail for each guideline can be found in the full report.
Rationale: Identifying the message or ‘communication goal’ of your visual enables you to tailor it so that it is easy for people to extract the main message from it.
Actions:
Write down, as concisely as possible, what message or messages you want your readers to be able to take away from the visual.
Refer back to the message throughout the design process to check that your design choices support readers in extracting the message.
When testing visuals ask readers to summarise what message they take away from the visual and check to see if it matches your intended message. Use this iterative feedback to amend the visual as needed.
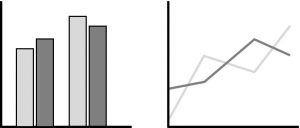
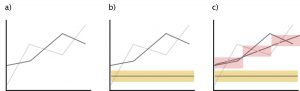
Schematic example:
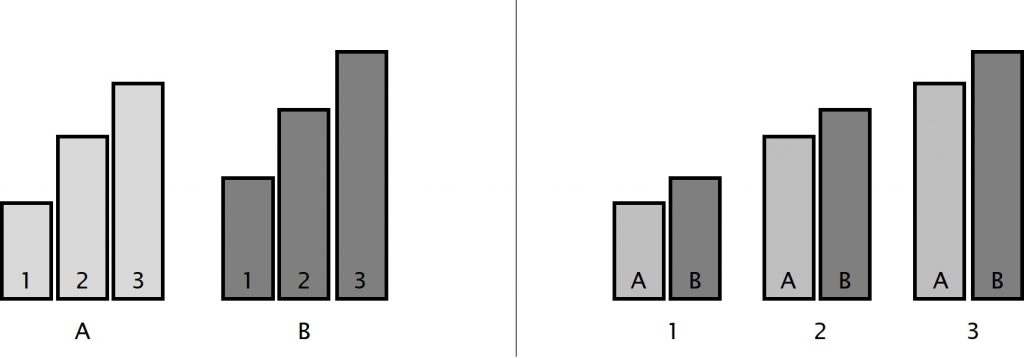
The left and right-hand visuals illustrated above show the same data in different layouts. If, for example, your main message is that there are subtle but important differences between A and B in the data, then the right-hand visual conveys this message more clearly than the left-hand visual.
Rationale: Understanding your audience’s prior knowledge enables you to create visuals that match their information needs and their level of existing knowledge.
Actions:
Interact and engage with your target audience(s) as much as possible – try to understand their information needs, responsibilities, and any constraints under which they operate.
Capture key characteristics of your audience(s). One way to do this is by using ‘user personas’ – these are short summaries that describe a group of readers.1
Refer back to your audience’s information needs throughout the design process – at each design choice, reflect on your options in relation to the audience.
Schematic example:
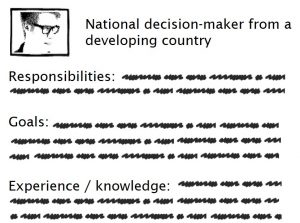
A user persona captures key characteristics of a group of similar users.
Rationale: Understanding how your audience ‘thinks’ can enable you to create visuals that match the cultural conventions and knowledge states of your audience.
Actions:
Represent information in visuals that match culturally accepted visual metaphors and support relevant inferences.
Avoid inadvertently representing information that matches culturally accepted visual metaphors, but doesn’t match relevant inferences.
Schematic example:
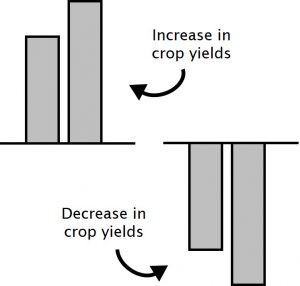
‘Up’ is normally associated with ‘good’, and ‘down’ with ‘bad.2 Here, metaphors and inferences match.
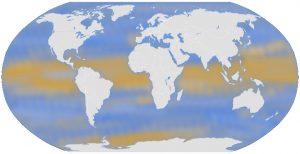
For maps, the colour blue is normally associated with the oceans. Hence, blue in the above example may not be automatically inferred as representing data. Here metaphor and inferences could mis-match.
Rationale: Choosing visual formats that are familiar to your audience enables them to quickly grasp how the data are structured, so that they can then focus on the message of the visual.
Actions:
Where possible, use visual formats that your audience is familiar with.
Bar graphs and line graphs are the most common graph types across a range of publications.3 Simple thematic maps are generally well understood.4
In some cases, an unfamiliar visual format might better enable readers to make inferences from the data if they develop an understanding of how the information is structured. In these circumstances, weigh-up advantages against possible disadvantages (e.g. will readers spend effort to work out the novel format?), and provide readers with guidance – e.g. build-up information and/or use text to provide explanations.
Schematic example:
Bar charts and line graphs are the two most common types of graph, and their formats are therefore generally well understood.

Other types of format, and more complex variations of bar charts and line graphs, are less common. If using an unfamiliar format, check that your audience understands it, provide supporting explanations, e.g. in text, or use a more familiar graph format instead.
Rationale: Reducing complexity in a visual enables your audience to focus on the main message(s) that you wish to communicate.
Actions:
Identify which information is essential to be included in the visual, which information is desirable to be included, and which information is not required to communicate your message.
Draft your visual to convey the essential and desirable information and then test it.
If your readers struggle to comprehend the visual, consider removing the desirable information and present the essential and the desirable aspects separately (i.e. for those readers who are interested in the extra detail).
Alternatively, make essential information more salient than desirable information or consider building-up information.
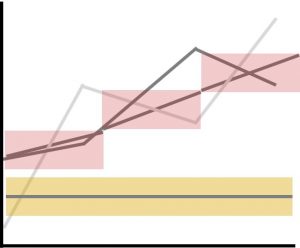
Schematic example:
Before:
After (visual complexity reduced):
Rationale: Building-up information enables you to focus your readers’ attention on specific points and guide readers’ thinking in a logical manner.
Actions:
Identify if there is a logical sequence to interpreting the information that would support your readers’ comprehension.
Present information in ‘key frames’ – i.e. multiple visuals that progressively add information – and integrate text to guide your readers through the visuals.
Numbering features in a visual can also be used to provide structure – explanations for each numbered feature can then be provided in text.
Schematic example:
Before:
After (information sequentially built-up):
Rationale: Integrating and structuring text enables your readers to easily match up information imparted in the text with the associated information in the visual.
Actions:
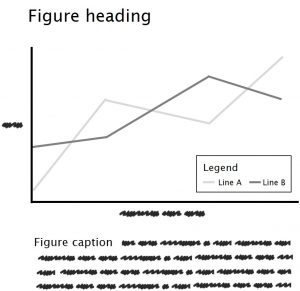
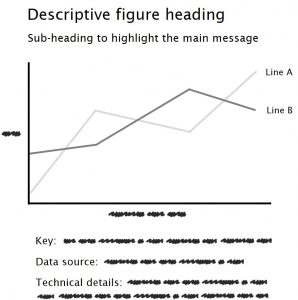
Give the visual a meaningful heading and sub-heading that communicates the main message.5
Position visuals as close as possible to accompanying text6 – avoiding the requirement for readers to turn pages or extensively scroll up/down to match the text and visual.
Integrate text labels in the visual rather than in separate legends.6
Try to avoid rotating text through 90° where possible.5
Structure figure captions so that readers can scan the information more easily.
Schematic example:
Before:
After (text integrated and structured):
Rationale: Avoiding jargon can help to ensure that a wider audience can understand the information, while explaining acronyms helps to ensure that readers know what they refer to.
Actions:
Use terminology that your readers are familiar with as much as possible – e.g. use lay terms in place of technical jargon.
Where unfamiliar terminology is used – e.g. because it has a precise technical meaning – explain it in the visual.
Explain acronyms in the visual, rather than assuming that readers will know where to look-up their meaning, or will use time / resources to do so.
Schematic example:
Before:
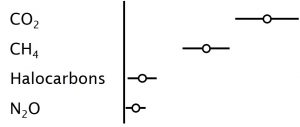
After (chemical formulae explained):

Rationale: Applying cognitive and perceptual design principles enables you to effortlessly direct readers’ visual attention to support their comprehension.
Actions:
Make important information visually salient by using contrast in colour or size, relative to less important information.7
Enable readers to visually link associated information by matching each set of information’s design properties (e.g. colour), or by grouping them close together.
Use arrows to direct visual attention between text labels and associated visual elements.
Schematic example:
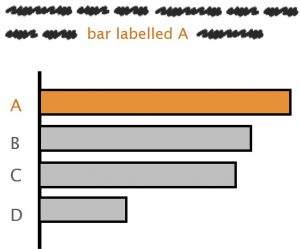
Contrast in colour can direct readers’ visual attention. Matching elements, e.g. text and data, enables readers to easily associate them.
Rationale: Animation and interaction open up new opportunities for communicating data and evidence, but also introduce cognitive challenges that can impair readers’ comprehension.
Actions:
Evaluate whether there is a strong argument to create an animated or interactive visual – carefully crafted static visuals might be easier for readers to comprehend.8
Give your readers control over playback (stop/start) and the playback speed of animations.9
Choose user interfaces (i.e. controls) for interactive visuals that your readers are already familiar with, or that are intuitive to use.
If interactive visuals require certain computing or software requirements that may limit accessibility, also provide static versions that convey the same message.
Test prototypes of animated and interactive visuals early in the design process and refine them based on feedback.
Schematic examples:

Small multiples (sequences of static visuals) may work better than animations.8
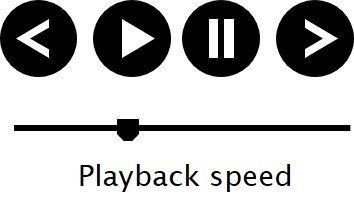
Provide user controls for animations.9
Rationale: Tailoring visual representations of uncertainty enables important aspects of uncertainty information (that are relevant to your readers) to be easily noticed (visually salient).
Actions:
If aspects of uncertainty information are important to convey, or are particularly helpful to support readers’ comprehension, directly represent those aspects – avoid readers having to infer them.
Make uncertainty information visually salient – information might not be comprehended if it is not easily perceived, for example, fine hatching and stippling in thematic maps may be unclear and go unnoticed.
Integrating short text labels in your visual can highlight to your readers how uncertainties should be interpreted.
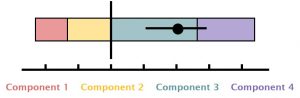
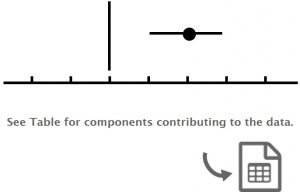
Schematic example:
Four visual representations of uncertainty:

There is no single ‘correct’ way to represent uncertainties in data. Be aware, however, that different representations may affect interpretation differently in different audiences.10
Rationale: Objectively testing your visual allows comprehension problems to be identified, enabling you to refine the visual before finalising, and giving you greater confidence that your audience will understand the information.
Actions:
Test drafts of a visual on your target audience – if representative members of your target audience are not available, test the visual with people who have a similar level of prior knowledge as your target audience.
Avoid re-testing revised versions of a visual on the same individuals – seeing earlier drafts will equip them with knowledge that a naïve audience may not have.
A basic testing approach is to ask a sample of people to interpret your visual and see if their interpretations match your intended message.
Where it is critical that your audience can understand the visual as intended, consider using more rigorous testing approaches that can help diagnose the reason(s) for comprehension problems, such as eye-tracking and ‘think aloud’ protocols.
If you are unsure how to test a visual, ask a psychological scientist or communications scientist.
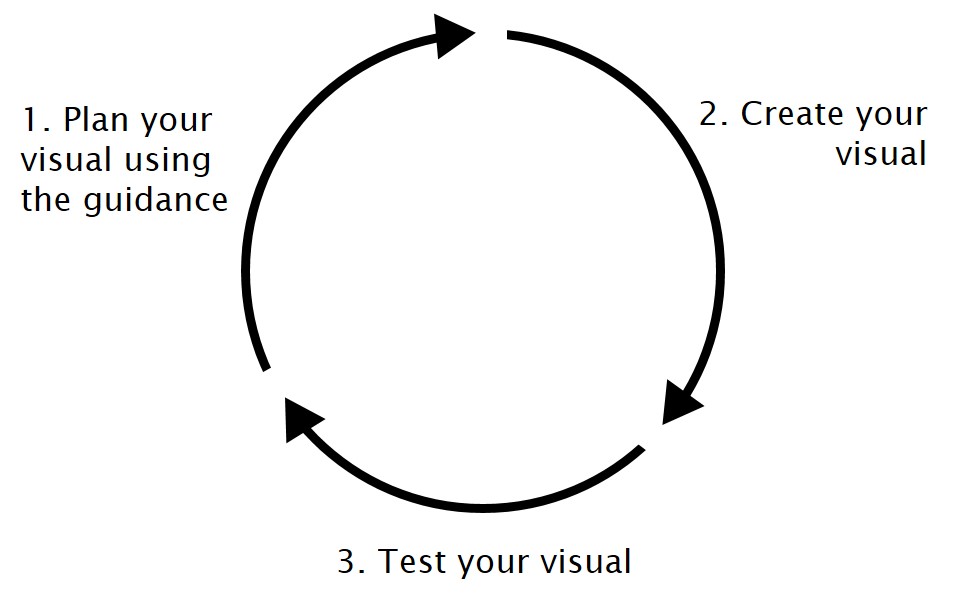
Use iterative design to refine your visual based on insights from testing.
Iterative design cycle:
Further information
Report authors: Jordan Harold, Irene Lorenzoni, Kenny R. Coventry, Asher Minns.
Suggested citation: Harold, J., Lorenzoni, I., Coventry, K. R., & Minns, A. (2017). Enhancing the accessibility of climate change data visuals: Recommendations to the IPCC and guidance for researchers. Report published by the Tyndall Centre for Climate Change Research, Norwich, UK.
Acknowledgements:
We would like to thank Richard Betts, Corinne Le Quéré and Rachel Warren for their helpful feedback during the development of the guidance report, and Espen Larsen (Norwegian Environment Agency) and Jonathan Lynn (IPCC) for their support in initiating the project. We are also very grateful to project’s funders and to the numerous members of the climate research and policy communities who provided valuable insights to the project via anonymous completion of an online survey.
Funding:
This work was supported by funding from the Norwegian Environment Agency (Miljødirektoratet) and from the High-End Climate Impacts and Extremes (HELIX Climate) project funded by the European Union’s Seventh Framework Programme for research, technological development and demonstration under grant agreement no 603864.
References:
1. Miaskiewicz, T., & Kozar, K. A. (2011). Personas and user-centered design: How can personas benefit product design processes? Design Studies, 32(5), 417-430.
2. Meier, B. P., & Robinson, M. D. (2004). Why the sunny side is up: associations between affect and vertical position. Psychological Science, 15(4), 243–247.
3. Zacks, J., Levy, E., Tversky, B., & Schiano, D. (2002). Graphs in print. In Anderson, M., Meyer, B., & Olivier, P. (Eds). Diagrammatic Representation and Reasoning (pp. 187-206). London, Springer.
4. Gołębiowska, I. (2015). Legend layouts for thematic maps: A case study integrating usability metrics with the thinking aloud method. The Cartographic Journal, 52(1), 28-40.
5. Evergreen, S. D. H. (2014). Presenting Data Effectively: Communicating Your Findings for Maximum Impact. London, Sage.
6. Tufte, E. R. (2006) Beautiful Evidence. Cheshire, Connecticut, Graphics Press.
7. Kosslyn, S. M. (1989). Understanding charts and graphs. Applied Cognitive Psychology, 3(3), 185-225.
8. Tversky, B., Morrison, J. B., & Betrancourt, M. (2002). Animation: Can it facilitate? International Journal of Human-Computer Studies, 57(4), 247-262.
9. Betrancourt, M. (2005). The animation and interactivity principles in multimedia learning. In Mayer, R. E. (Ed.) The Cambridge Handbook of Multimedia Learning (pp. 287–296). Cambridge, Cambridge University Press.
10. Bosetti, V., Weber, E., Berger, L., Budescu, D. V., Liu, N., & Tavoni, M. (2017). COP21 climate negotiators’ responses to climate model forecasts. Nature Climate Change, 7, 185-189.
This website uses cookies to improve your experience. Read more.